Epigenomics
Decode non-sequence genetic modifications and explore how the environment shapes gene expression through these marks.
ATAC-Seq
ATAC-seq (Assay for Transposase-Accessible Chromatin with high-throughput sequencing) detects open chromatin regions. Simple, low cell input (as few as 500 cells) and fast, it is now a key tool in epigenetics and gene regulation. Eukaryotic DNA is packaged with histones into chromatin; regulatory elements (promoters, enhancers) lie in loose, open chromatin bound by transcription factors. ATAC-seq tags these open regions to map genome-wide chromatin accessibility, indirectly revealing regulatory networks.
Principle Introduction
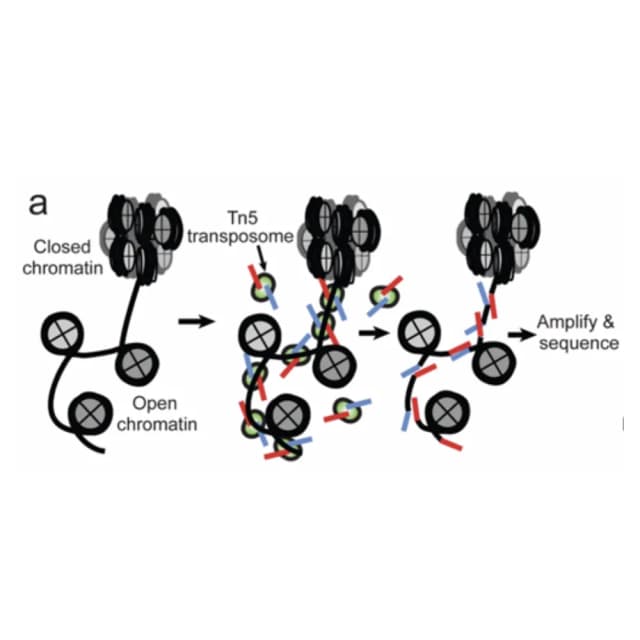
ATAC-seq uses a hyperactive Tn5 transposase. Mixed with gently lysed nuclei, Tn5 binds open chromatin and simultaneously cuts DNA and ligates sequencing adapters to fragment ends—acting as a "molecular scissor" with built-in adapters. A simple PCR yields a sequencing-ready library. Sequencing and alignment map these fragments to open chromatin regions genome-wide.
Literature
Published in Cell, "A single cell atlas of in vivo mammalian chromatin accessibility" applied combinatorial indexing (sci-ATAC-seq) to ~100,000 single nuclei across 13 adult mouse tissues, identifying 85 cell populations with distinct accessibility (69 annotated). Cicero built >4.4 M cis-regulatory links associating distal elements with target promoters and computed "gene activity scores," bridging scATAC-seq and scRNA-seq for cross-modal annotation. Convolutional networks (Basset) revealed TF motif syntax (GATA, MEF2, PPAR dominant in lineages). Cross-species integration of mouse open chromatin with human GWAS via LD Score regression identified cell-type-specific heritability signals at single-cell resolution—e.g., Alzheimer's in microglia, bipolar disorder in excitatory neurons—providing the first in vivo mammalian single-cell accessibility atlas and a basis for precision medicine.
Sample Requirements
viability ≥90%, ≥200,000 cells/sample.
>300 mg.
young leaves ≥0.3 g; seeds/roots/stems (fresh young) ≥0.5–1 g.
Deliverables
Basic analysis
alignment (BAM), alignment summary, open region identification, peak annotation (nearest gene, element type).
Key metrics
TSS enrichment, FRiP, fragment length distribution, total reads, Q30, effective alignment, peak count.
Visualization
sample correlation heatmap & PCA; differential analysis (multi-group) with DARs (BED+annotation) and peak plots (heatmap, volcano, clustering).
Advanced
motif enrichment, TF footprinting, multi-omics integration, regulatory network.
FAQ
High mitochondria signals poor nucleus extraction or low open chromatin; optimize lysis/centrifugation to enrich intact nuclei and filter chrM reads post-alignment, assessing peak-calling impact.
Indicates Tn5 failed to distinguish cut; check cell viability/nuclear integrity (dead/broken nuclei release genomic DNA as background), titrate Tn5 and control temperature/time. In sperm, histone-protamine replacement erases nucleosomes—a biological phenomenon.
