Metabolomics
Capture the direct signals of phenotypic change through precise metabolite quantification — a direct readout of physiological status.
Fluxomics
Metabolic flux analysis uses stable-isotope tracing combined with mass spectrometry to track the flow and rate of labeled atoms through metabolic pathways, quantitatively depicting flux distribution across central carbon, amino acid, and lipid networks—a core tool for metabolic regulation research.
Principle Introduction
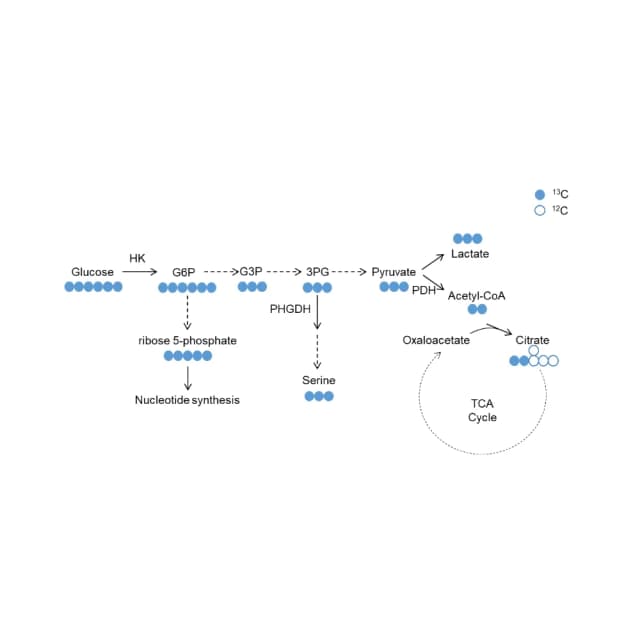
Metabolic flux analysis uses stable-isotope tracers (e.g., [U-13C] glucose, [1,2-13C] glucose) to measure the isotope labeling pattern (mass distribution vector, MDV) of downstream metabolites, inferring flux and distribution. Conventional metabolomics measures static concentrations, which can rise from increased production or decreased consumption; isotope tracing directly follows flux. For example, with [1,2-13C] glucose, glycolysis puts both 13C into pyruvate (M+2 ~50%), while the pentose phosphate pathway releases one as CO2 (M+1 ~50%); M+0/1/2 abundances estimate each pathway's contribution. Detection uses Thermo Q-Exactive plus with Vanquish UPLC (HILIC), correcting natural abundance for true MDV.
Experiment Flow
Isotope labeling
culture cells or feed animals with tracers and collect samples over time.
Sample prep
quench and extract in cold solvent; sonicate and centrifuge the lysate.
Concentrate & reconstitute
lyophilize the extract and reconstitute in solvent ready for assay.
LC-MS
run on Thermo Vanquish UPLC-Q-Exactive with a ZIC-HILIC column.
Data analysis
process in TraceFinder/Xcalibur and compute corrected MDV values.
Statistics
compare isotope differences and cluster differential metabolites.
Sample Requirements
animal tissue, cells, plasma/serum, urine, CSF, plant, microbe, etc.
80 mg (risk 50 mg); ≥8 replicates suggested.
200 μL (risk 80 μL); heparin sodium preferred for plasma.
sufficient per targeted-metabolite standard; consult pre-sales for tracer design.
-80℃ within 3 yr; aliquot to avoid freeze–thaw; dry ice; liquids snap-freeze 2 min then -80℃.
Deliverables
Isotope distribution
retention time, m/z, peak area, MDV and corrected MDV tables.
Difference analysis
comparison-group MDV bar charts, t-test p<0.05 significance, differential list.
Clustering heatmap
hierarchical clustering of significant metabolites (Z-score).
QC
QC RSD plot (RSD<30%, ≥10 QC interspersed) and pass report.
Sample/group table
time points, tracer type, biological-replicate IDs.
Final report
metabolic-flux PDF with methods, figures, interpretation, all attachments.
FAQ
Natural 13C, 2H, 17O also raise mass; measured M+1 may sum several sources, so element natural abundance must be corrected for true MDV.
